Choose a PHOTO SUBSCRIPTION and download FREE RIGHTS images.
Plans and prices of the image bank.
Login
Royalty Free Image
647578374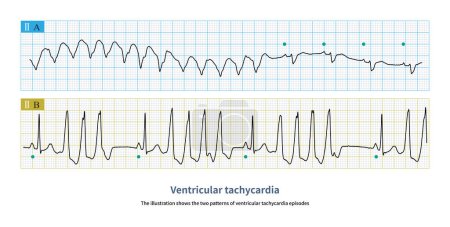
- Id: 647578374
- Media type: Photography
- Author: asia11m
- Keywords:
graphic rate medical Cardiology heart pulse science death rhythm diagnosis Heartbeat Cardiac ekg electrocardiogram Ecg excitation palpitation tachycardia arrhythmia palpitations tachyarrhythmia Heart Disease depolarization syncope cardiac arrest left ventricle right ventricle cardiovascular disease sudden death sinus rhythm ischemic heart disease ventricular tachycardia ECG monitoring conduction disorder p wave ecg education qrs wave wide qrs tachycardia cardiac electrical activity ventricular depolarization electrocardiogram education organic heart disease ventricular fusion wave atrioventricular dissociation qrs wave alternation negative consistency atrioventricular separation ventricular capture sinus capture
Categories
| Size | Width | Height | Mp |
|---|---|---|---|
| s | 500 px | 253 px | 0.5 |
| m | 1000 px | 506 px | 2 |
| l | 2000 px | 1012 px | 8 |
| xl | 10000 px | 5059 px | 15 |
You are not logged in!
Please login to download this image.